


Risk management KPIs for industrial operations are measurable indicators that show whether risk controls work. A strong set pairs lead indicators, which verify that controls operate, with lag indicators, which record outcomes such as incidents and costs. SafeWork NSW (2020) advises starting with a handful of critical controls rather than measuring everything.
Australian workers lodged more than 400 serious compensation claims every day in 2023-24, according to Safe Work Australia. Every one of those claims records harm that had already happened. The KPIs you track decide whether you see the next one coming.
This guide sets out seven risk management KPIs for industrial operations. It sorts them into lead and lag indicators and shows how to choose the first three to track.
Key Takeaways
- Pair lead with lag indicators. Lead indicators verify that controls operate, and lag indicators record the harm that still occurs. Each answers a different question.
- Start with three KPIs, not twelve. Choose the controls that protect against your highest-consequence risks and build indicators around those.
- Define every formula in writing. Some firms calculate lost time injury rates per 1 million hours and others per 200,000 hours, so unlabelled figures cannot be compared.
- Test each indicator against your own data. A 2025 scoping review found no two studies asked the same question about leading indicators, so the evidence on which ones work is thin.
- Review the set every quarter. Drop any KPI that has not prompted a decision.
Why Do Risk Management KPIs Matter in Industrial Operations?
Risk management KPIs matter because harm concentrates in a few industries and a few causes. Safe Work Australia’s 2025 statistics show 80% of worker fatalities and 61% of serious workers’ compensation claims occurred in just six industries. Manufacturing, construction, and transport sit among them.
The same release records 188 worker fatalities in 2024, and vehicle incidents caused 42% of them. For a fleet operator, that makes vehicle and driver risk the first place to look for indicators.
Counting outcomes alone leaves a gap. An incident count tells you a control failed. It does not tell you which control is about to fail next. Industrial sites run heavy plant, hazardous materials, and tight regulatory duties. The gap between what happened and what is about to happen carries real cost.
KPIs close that gap when they are chosen deliberately. They turn a risk management programme from a register of hazards into a set of numbers that prompt decisions.
Lead vs Lag Indicators: What is the Difference?
Lead indicators measure the inputs that prevent harm, such as inspections completed and risks closed on time. Lag indicators measure outcomes after the fact, such as incidents and costs. SafeWork NSW (2020) says both matter because they provide different information. A set with only lag indicators reports failures. A set with only lead indicators cannot show whether controls work.
The guide is direct about lost time injury rates. It calls them “productivity indicators, not valid and reliable measures of damage to people”. They show how much work time an injury cost. They say little about how badly someone was hurt.
Both indicator types can describe the same control. Take a new guard on a press. The percentage of operators trained on the guard is a lead indicator. Incident reports involving that press are the lag indicator. If training completion rises and press incidents do not fall, the control is not working as intended.
SafeWork NSW (2020) also ranks fit above comparison. Monitoring the controls that matter most to your business is more valuable than benchmarking against another company.
7 Key Risk Management KPIs Industrial Operations Should Track
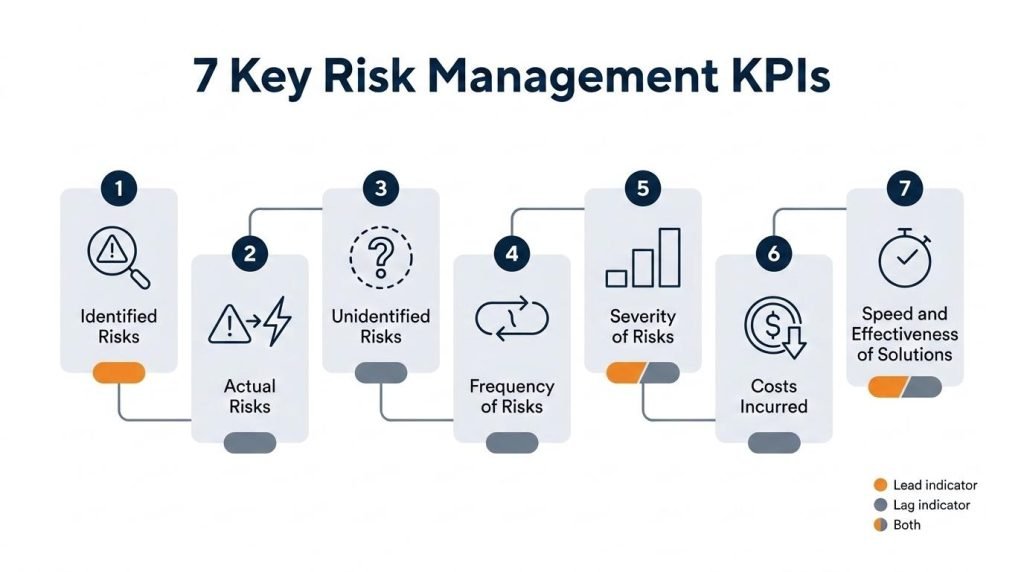
Seven KPIs cover the full risk cycle: detection, realisation, blind spots, patterns, consequence, cost, and response. Together they show whether risks are visible, whether controls hold, and whether treatments work. WorkSafe Western Australia (2024) publishes guidance for operators developing leading and lagging indicators for their facilities, which suits process-heavy sites.
1. Identified Risks (lead)
Identified risks counts the hazards and risks your team reports and logs in a given period. This is the first stage of the risk management process, and it is a lead indicator because it measures visibility. A count that stays near zero points to a reporting gap before it points to a safe site. Track it per site per month and compare it with near-miss reports from the same period.
2. Actual Risks (lag)
Actual risks measures the percentage of identified risks that became incidents, delays, or non-compliance. It is a lag indicator that shows which reported risks escalate. Divide risks that caused an impact by total risks identified, then rank by category. Categories with a high conversion rate need stronger controls first.
3. Unidentified and Unanticipated Risks (lag)
This KPI counts incidents and issues that arose from hazards nobody had logged. It measures the limits of your risk register. A rising count signals gaps in hazard identification, trend analysis, or early warning. Review each unanticipated event and add its hazard to the register within a set number of days.
4. Frequency of Risks (lag)
Frequency of risks counts how often a given risk occurs over a set period, across projects or departments. Repeat occurrences point to a root cause that controls have not removed. The common form is incident frequency rate: incidents per 1 million hours worked. State the denominator on every report, because identical labels hide different formulas.
5. Severity of Risks (lead and lag)
Severity of risks rates the potential or actual consequence of each risk. Use fixed categories with written definitions, such as temporary impairment versus permanent harm. A fixed scale directs resources to the few risks that cause the worst damage. Frequency alone hides them, because minor events far outnumber major ones.
6. Costs Incurred Due to Risks (lag)
Costs incurred due to risks totals downtime, repairs, fines, claims, and lost production attributed to risk events. It converts risk into the unit a finance team uses. Record each cost against the risk ID when the event happens, because costs rebuilt months later are estimates.
7. Speed and Effectiveness of Solutions (lead and lag)
Speed is the average number of days from a risk being logged to its control being in place. Effectiveness is the share of treated risks that do not recur within a set period. Speed is a lead indicator and recurrence is a lag indicator. Track them together, because a fast fix that fails twice is not an improvement.
The 7 KPIs at a Glance
| KPI | Type | Question it answers | Unit |
| Identified risks | Lead | Are we seeing our hazards? | Count per site per month |
| Actual risks | Lag | Which reported risks escalate? | % of identified risks |
| Unidentified risks | Lag | What is our register missing? | Count per quarter |
| Frequency of risks | Lag | Where do repeats cluster? | Per 1 million hours worked |
| Severity of risks | Lead and lag | Which risks do the worst damage? | Fixed severity classes |
| Costs of risks | Lag | What does risk cost us? | Dollars per risk ID |
| Speed and effectiveness | Lead and lag | Do our fixes work, and how fast? | Days to control, % recurrence |
Regulated operators should add a compliance rate as a further lag indicator: audited requirements met divided by requirements audited. Draw it from the data you collect when conducting audits, not from a separate spreadsheet.
Where Should You Start with Risk KPIs?
Choose the first three KPIs by working backwards from your highest-consequence risks. Pick one critical control for each risk, then assign a lead indicator that verifies the control and a lag indicator that records its failure. Start small, because every extra indicator adds reporting effort and dilutes attention.
- List your top five risks by severity.
- Name the critical control that protects against each.
- Assign one lead indicator and one lag indicator to each control.
- Write down the formula, denominator, owner, and review date for every indicator.
Draw each indicator from records your safety and quality systems already hold, so nobody keys the same data twice. Then test each indicator against your own data.
A 2025 scoping review in the Journal of Safety Research found that no two studies assessed the same research question. That prevented any synthesis of how well leading indicators perform. The review concludes that indicator choices should rest on evidence that they improve safety.
Your incident history is the best evidence available to you. If a lead indicator moves for six months and incidents do not change, replace it.
How Does Technology Help Track Risk KPIs?
Technology helps because consistent definitions need one place to live. A 2013 review co-funded by Safe Work Australia found that firms present injury rates under the same label but calculate them differently. Some use 1 million hours and others use 200,000 hours. That blocks comparison over time. A single platform that stores risks, audits, and incidents applies one definition to every site.
A spreadsheet works for one site with one risk register. It fails when the second site adds its own columns, because KPI definitions begin to diverge. Kynection’s One System holds risk management, safety management, and audit records inside the QHSE module, therefore each KPI above reads from the same record.
Whichever risk management software you choose, check for three things:
- Dashboards that show lead and lag indicators side by side.
- Alerts when a threshold is crossed.
- Reports that state every formula and denominator.
Larger operations roll site-level KPIs up into enterprise risk management, so every site needs the same definitions.
Regulated sites also feed the compliance rate into governance, risk and compliance reporting.
Track the Controls Before the Incidents Arrive
Industrial risk management needs both lead and lag indicators. Seven KPIs cover the full risk cycle, but three are enough to start. Pick the three controls that protect against your highest-consequence risks. Pair each with a lead indicator that verifies it and a lag indicator that records its failure.
Write down the formula, denominator, owner, and review date for every indicator. Because definitions drift between sites, one written version keeps your figures comparable over time.
Then test each indicator against your own incident history. If a lead indicator moves for six months and incidents do not change, replace it. Therefore, every KPI on your dashboard earns its place by prompting a decision.
Kynection’s One System holds risk, safety, and audit records in one place, so each KPI reads from the same record. Book a demo and bring one real risk register to see it work.
Frequently Asked Questions
What are risk management KPIs?
Risk management KPIs are measurable indicators of how well an organisation identifies, controls, and responds to risk. They split into lead indicators, which verify that controls operate, and lag indicators, which record incidents and costs. A useful set contains both.
What is the difference between a KPI and a KRI?
A KPI measures how well you are achieving an objective. A key risk indicator, or KRI, signals a rising threat before it becomes an incident. The two overlap in practice, because a lead indicator such as overdue inspections works as both.
How many risk KPIs should an industrial operation track?
Start with three, tied to your highest-consequence risks, and grow toward seven. SafeWork NSW (2020) advises selecting a handful of critical controls rather than measuring everything. Add an indicator only when an existing one has prompted a decision.
Is lost time injury frequency rate a good risk KPI?
It is a useful productivity measure and a weak risk measure. SafeWork NSW (2020) calls lost time injury rates inappropriate for informing WHS due diligence. A 2013 review co-funded by Safe Work Australia found firms calculate them per 1 million or per 200,000 hours. Use the rate alongside severity and lead indicators, and state the formula.
How often should risk KPIs be reviewed?
The 2013 Safe Work Australia co-funded review says leading indicators need regular review to stay appropriate as an organisation changes. A quarterly review of the whole set, with the data read monthly, is a practical default for most operations.

Ready to take your business to the next level?
Discover how Kynection can help streamline your operations, improve efficiency, and drive growth. Book a demo today and see the difference for yourself!